

Bogota
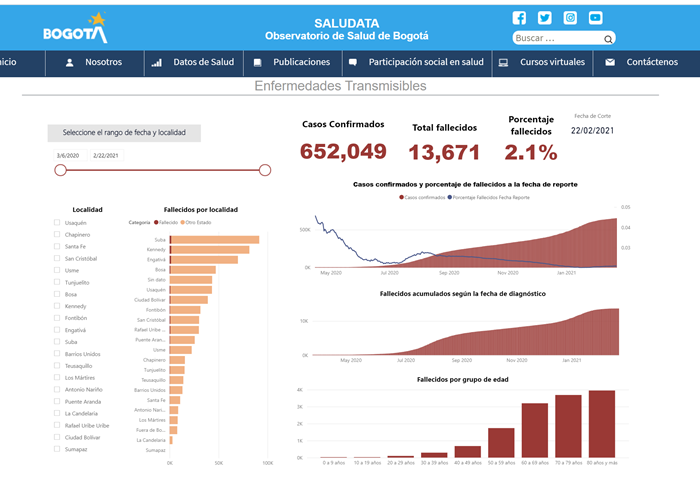
These data are from the government of Bogota official website for COVID-19 as of February 22, 2021. The image below illustrates on the left in green the proportion of people already recovered and in blue the current people with Covid-19. Each bar represents one of the twenty Wards (Localidades) of Bogota. On the right, the numbers represent the total cases registered from the beginning of the pandemic to February 22, 2021. Additionally, the numbers indicate that 95.5% of people who had gotten the virus recovered.

The image below includes information about the number of deaths as a share of the total cases (numbers in red on the top). The horizontal bars break down the numbers by Localidades (Wards), with red representing the proportion of deaths. The Localidades with more deaths were Suba, Kenedy and Engativa. Additionally, the visual depicts the deaths by age on the bottom. One takeaway from this is the 2.1% of deaths as a share of the total cases. As expected, the age group with a higher number of deaths was over 70, which was closely followed by 60-69 group.
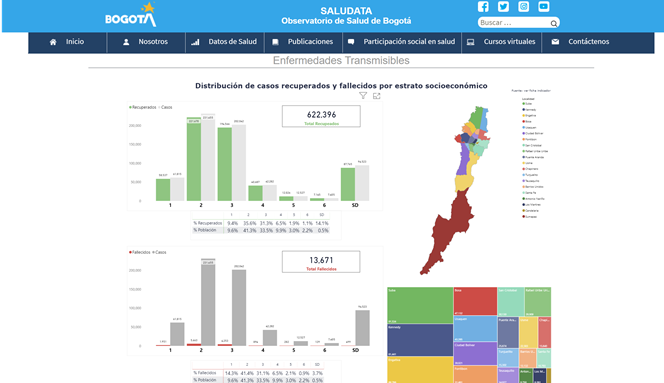
Below is a report of COVID-19 total cases distributed by social class (bars),which are six in Colombia, in which one corresponds to the poorest and six to the wealthiest. The green and grey bars represent the number of recovered people (in green) and the number of total cases (in gray) by socioeconomic strata (social classes). The darker gray and red bars represent the total cases and deaths, respectively. For example, the most affected social class was the middle class (numbers 2 and 3) in both the number of cases and number of deaths. On the right, there is the map of Bogota divided by localidades (wards). Each color represents one of the twenty localidades of Bogota.
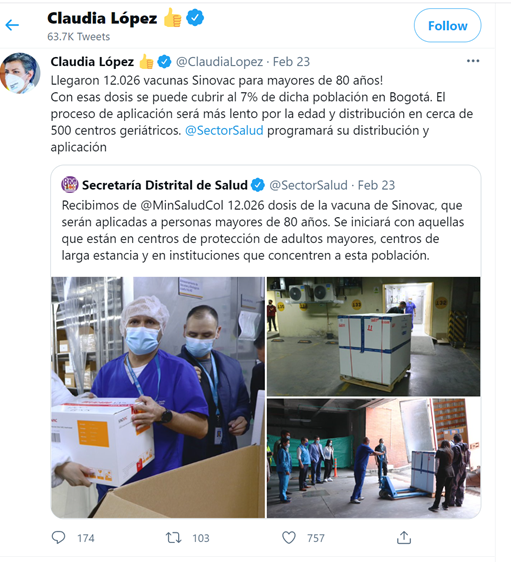
From the official Twitter account of Claudia Lopez, who is the first woman elected as mayor in Bogota, celebrating the arrival of the first 12,026 vaccines. These vaccines came from the China pharmaceutical firm Sinovac. These first doses were destined to people older than 80. (February 23,2021)
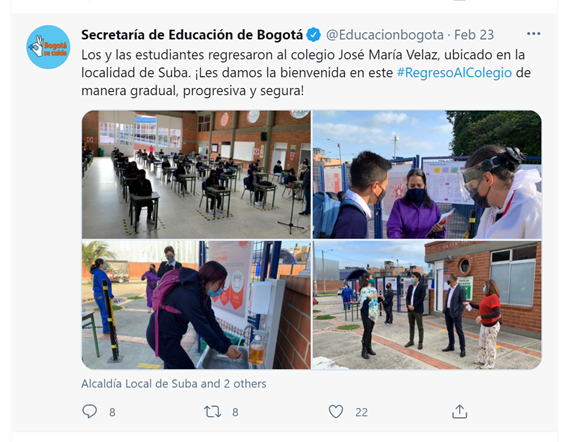
As of February of 2021, Bogota started implementing hybrid schooling as an effort to gradually return students to classrooms. Source: Official Twitter of the education office of Bogota
The images below illustrate a school located in the Ward of Bosa, which is one of the most populated wards of Bogota and one of the most affected by Covid-19.
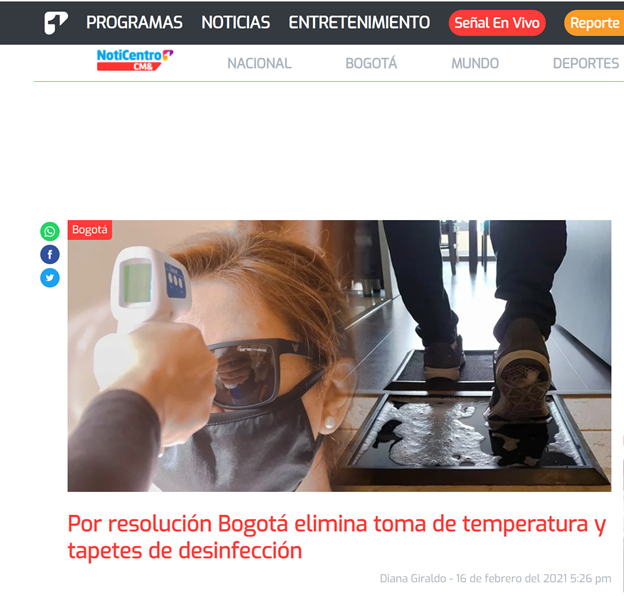
It was mandatory to take the temperature of each person entering public buildings and to put their shoes in a drench carpet of alcohol in order to disinfect the person from Covid-19. This regulation was removed by the authorities of Bogota on February 16 because of the lack of scientific support.
There were some crowds in Bogota mainly in informal shopping areas during December of 2020. As the image shows there were some efforts to stop the spread of Covid-19 by spraying alcohol over the crowd. Reported by Citytv one of the local TV channels of the city.

Shanghai
As of February 24, 2021, according to the Shanghai Municipal Government, Shanghai has only had 22 new COVID-19 cases since January. All of the cases were infected by the same overseas source, and they were treated with a mix of anti-infection therapy and traditional Chinese medicine.
Even though all of China has not had a significant number of COVID-19 cases in almost a year, the country is still following stringent health and safety guidelines, including outdoors mask-wearing and social distancing, exhibiting a new post-pandemic normal for the world.
Shanghai has begun to administer Sinovac doses, the vaccine funded by the Chinese government, which has shown to be 50% effective in Brazil but is advantageous for developing countries because it does not need to be stored at low temperatures. Currently, there are 17 vaccination sites in Shanghai covering 16 districts.
Cumulative Statistics (Wikipedia).

A new normal: children wear masks and social distance, waiting to get their temperature checked before going to school (Bloomberg Quint).

Singapore

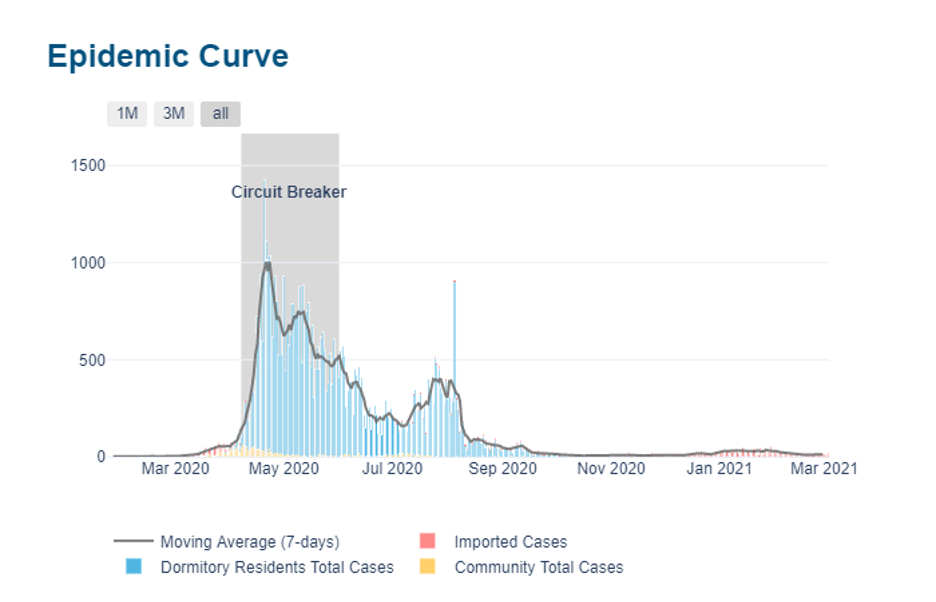
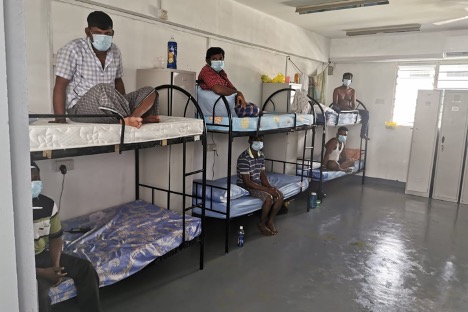
As of March 3, 2021, about a full year into the Covid-19 pandemic, Singapore has achieved just under 60,000 cases and 29 deaths (Ministry of Health of Singapore “Updates on Covid-19,” 2021). The country has one of the lowest Covid-19 death rates in the world at 0.05% (Geddie 2021). To no surprise, Singapore also holds one of the highest “swab rate per capita,” having administered Covid-19 tests to 15% of its population (Geddie 2021). The country has had a mask mandate since April, and any positive person over the age of 45 automatically gets a hospital bed for treatment and monitoring (Geddie 2021). As shown in figure 1, the country has already begun its vaccination program, being the first country in Asia to approve the Pfizer vaccine and having already approved a Chinese vaccine, and has vaccinated about one fifteenth of its population so far (Aljazeera 2020) (Ministry of Health of Singapore “Updates on Covid-19,” 2021). Figure 2 shows a spike in cases early on during the pandemic, followed by a flattened curve and current cases at a near-zero level. The initial spike was from outbreaks in migrant-worker dormitories which hold hundreds of thousands of people (Neo 2020). Figure 3 shows how difficult it is to social distance in an environment where six to twelve people are living in the same room, but the government quickly clamped down and instituted isolation and sanitary measures that prevented further outbreak. While the outbreak in the dormitories was suppressed, cases in dormitories still account for 95% of infections in Singapore (Neo 2020).
Wellington
All data for New Zealand is from the New Zealand Ministry of health. Of note Wellington is listed in all data as Capital and Coast, which I found to be a little peculiar, though is perhaps indicative of the spread of the population to surrounding areas that are technically outside of the city limits. Most data has been divided by city or region depending on population it appears. Overall, the data demonstrates that New Zealand as a whole but Wellington as well, has done a good job at containing COVID but that vaccination access and distribution have caused delays in a true “return to normal”.

As of May 5th 2021, the number of COVID cases in New Zealand. Wellington has had fewer cases or deaths than Auckland or Canterbury.
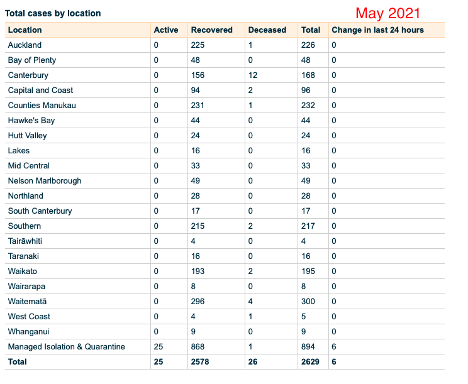
Also from May 5th 2021, Wellington had no active COVID cases, and had had 96 total cases, with 2 deaths and 94 recovered. Compared to other areas globally Wellington and New Zealand overall appear to have responded well to the crisis. With a total population around 4.9 million they’ve only had 0.05% of their population contract the disease. For comparison the US and Canada have had 10% and 3.5% of their populations contract COVID respectively.

The above is a summary of the vaccinations in New Zealand as of May 11th 2021. This indicates that around 2.4% of their population has been fully vaccinated and 5.4% have been partially vaccinated. Though New Zealand has done well in containing COVID they did not start vaccinations until mid-February due to delays in accessing supply. As such they now lag other countries such as the US which as of mid-May 2021 had around 35% of its population fully vaccinated and 46% partially vaccinated. For further comparison, Canada, had a similar level of fully vaccinated individuals of only around 3.5% of its population but 43% of the population were partially vaccinated by mid-May 2021.
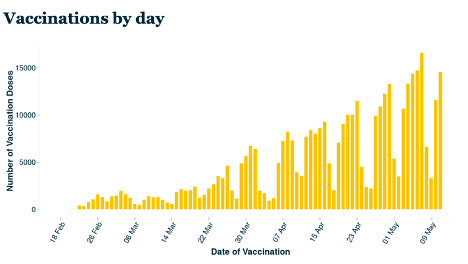
The above charts the number of vaccinations per day in New Zealand up to May 11th 2021. This graph does indicate some reason for optimism as it makes clear that vaccination distribution is increasing in New Zealand.
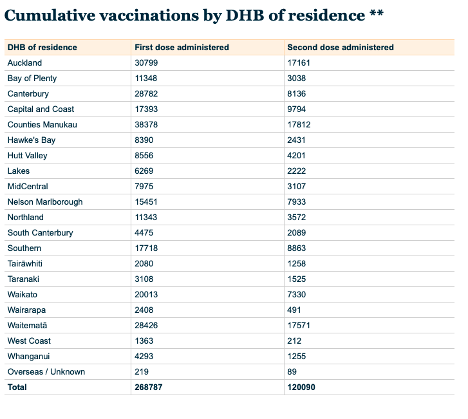
As of May 11th 2021 Wellington has over 17 000 residents who have received their first dose of a COVID vaccine and almost 10 000 residents are fully vaccinated. These numbers are low compared to Auckland for example, but this discrepancy could be linked to the difference in population between the two cities.